|
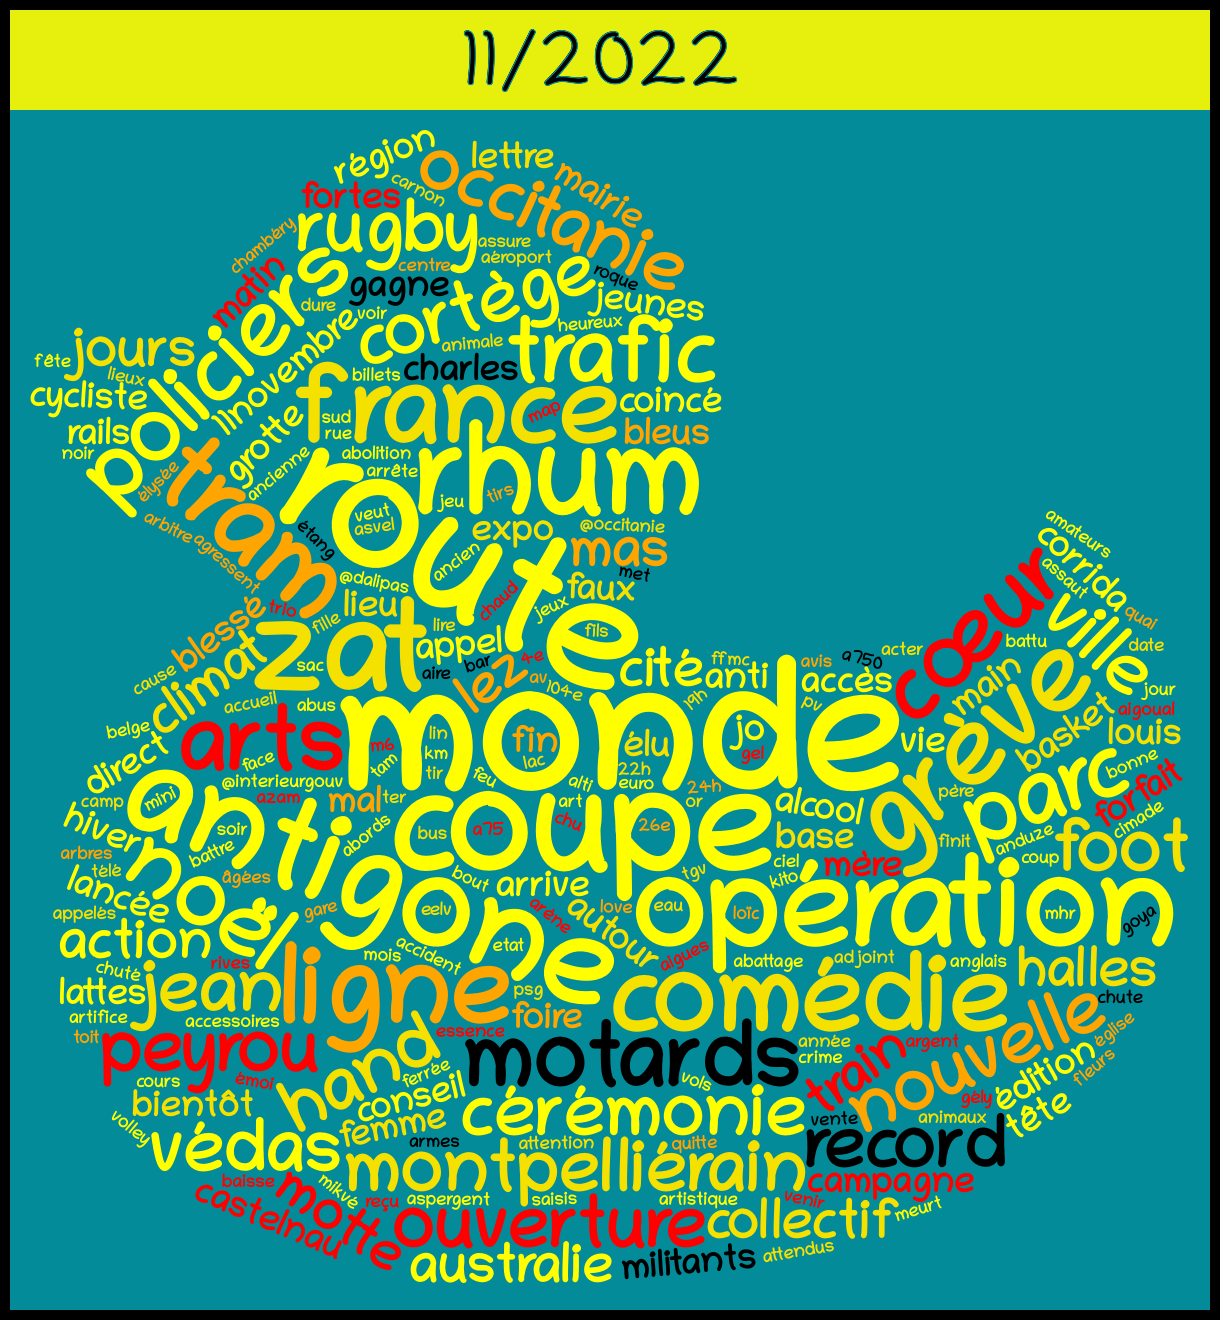
La Gazette, mon petit canard : ConcoursConcours de la Gazette de Montpellier Le jeu-concours : racontez-nous, sur le thème “La Gazette, mon petit canard”, une histoire ou anecdote que vous inspire La Gazette : texte (court), poème, chanson, vidéo, rap, histoire drôle, tableau, sculpture… Laissez parler votre créativité. Les créations les plus originales, amusantes, pertinentes, émouvantes, acides, délirantes,… gagneront l’un des 35 lots. Surprenez-nous ! Envoyez votre production (texte, vidéo, photo, etc.) par mail à jb. |
magick

|
Imprimer 4 images en portrait sur un A4Ou Dès fois Ubuntu, c’’est un peu relou… Mais heureusement il y a R L’idée, c’est de mettre 4 images en portrait sur une feuille A4 parce que personne a décidé de coder ça dans le truc d’impression d’Ubuntu 😕. Allez au boulot, on sort les 📦 et c’est parti ! On commence par lire l’image (1.png c’est la sortie Canva jme suis pas foulée), et la mettre dans img. |
|
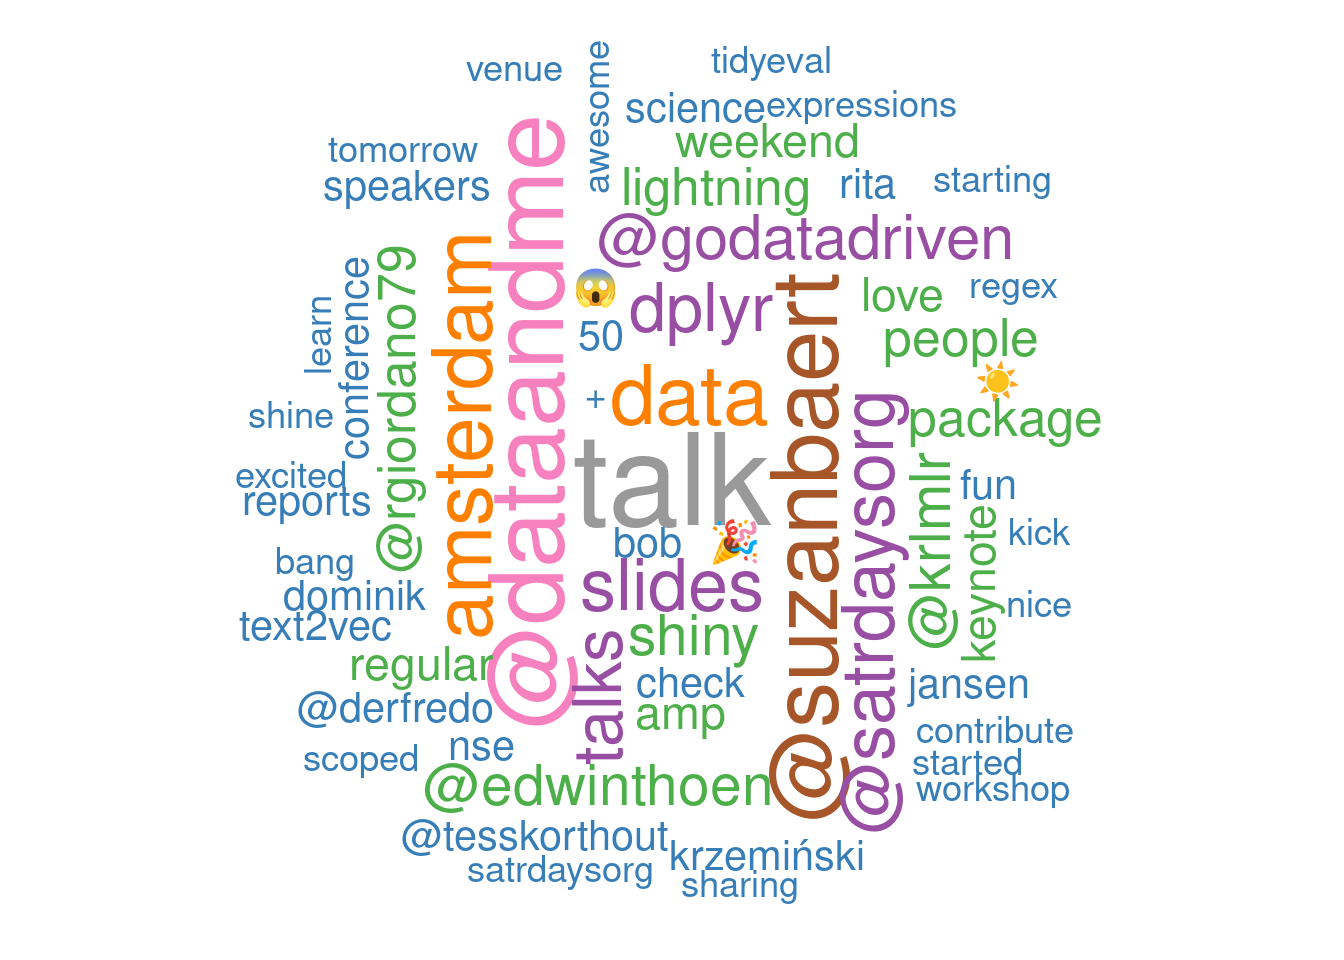
AmstRday's tweetsThese lines of code have been lying around in a file for more than 2 months. I wrote them after SatRdays Amsterdam in September. Packages installation library(tidyverse) library(rtweet) library(knitr) library(kableExtra) library(ggiraph) library(magick) library(tidytext) library(wordcloud) library(widyr) library(igraph) library(ggraph) library(ggmap) library(maps) library(plotly) Scraping the tweets # rt_AmsteRday <- search_tweets( # "#AmsteRday", n = 2, include_rts = FALSE # ) # rt <- rt_AmsteRday # # vect <- c("#AmstRday", "#satRday", "#satRdays", "#satRdayAMS", "#satRdaysAMS") # # for( vec in vect){ # # rt_vec <- search_tweets( # vec, n = 18000, include_rts = FALSE # ) # rt <- bind_rows(rt, rt_vec) # } # # # rt <- rt %>% # unique() # # saveRDS(rt, "conttweets. |
|
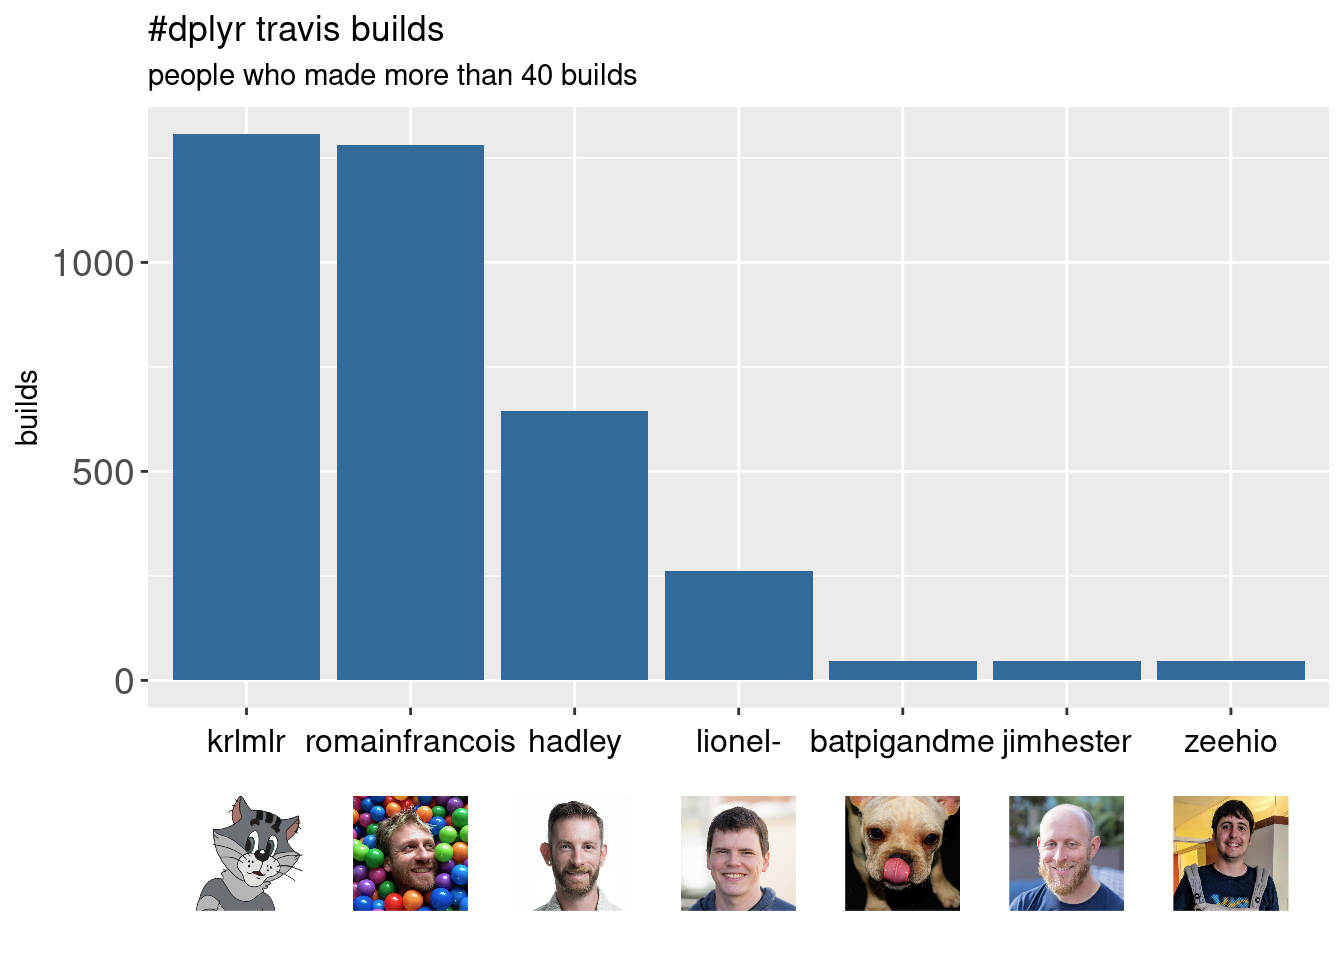
Playing with dplyr5000 - Part 1dplyr5000 is a data package with the 5000 first travis builds of dplyr. I would like to make a beautiful barplot with these data, inspired by this tweet from Mara Averick. 📷 Further adventures in ggplot2 x-axis image labels… "Images as x-axis labels (updated)" ✏️ @carroll_jono "photo alignment with graph in r" (SO answer) @ClausWilkehttps://t.co/p8Tvs4sghn #rstats #dataviz /* ⛹️📊 atrocities mine, obvs */ pic.twitter.com/Wew5Wo9q4f — Mara Averick (@dataandme) October 11, 2018 Packages gh allows to get data from github. |
|
Making an animated ggplotI decide to talk about how I make my awesome blog banner in this first post. 😄 Why this banner ? It’s a french wordplay with my family name Sauder => Saut d’R (R jump in english). That’s why I decided to make a banner with the R-logo jumping on some (so cool) stickers. I choose stickers of packages that I use to do this animated ggplot. Which packages ? library(tidyverse) # install. |